The Complete Business Case for Sourcing Tires from China
The opportunity is clear: China dominates global tire manufacturing with 1.18 billion units produced in 2024-more than any other country. For U.S. importers, wholesalers, retailers, and fleet operators, sourcing directly from Chinese manufacturers offers quantifiable advantages: FOB prices 40–60% lower than domestic suppliers, access to a portfolio spanning passenger cars to heavy-duty commercial vehicles, and minimal capital barriers for entry.
However, the 2026 import environment presents both unprecedented opportunities and structural risks. Trump-era tariff policies have introduced complexity: Section 232 tariffs on automotive parts (including tires) now impose 25% duties on medium- and heavy-duty truck tires as of November 2025, while reciprocal tariffs on Chinese imports range from 145% for general goods to variable rates by category. Understanding landed costs-not just FOB prices-is the critical difference between 15% profitability and losses of 40%+.
This guide synthesizes real market data from January 2026, validated supplier quotes, and regulatory frameworks to equip decision-makers with actionable intelligence for profitable tire imports.
Understanding the 2026 Market Landscape
Why Importers Source Tires from China
The economics are structural, not cyclical. China’s tire industry operates at 60+ million units annual capacity across leading manufacturers alone. This scale generates three distinct advantages:
- Cost advantage: Budget passenger car tires FOB at $20–$60/unit, compared to $100–$150+ at U.S. distributors. Even after tariffs and freight, importers achieve 20–35% total landed cost savings versus domestic wholesale.
- Product diversity: Chinese manufacturers produce 200+ tire specifications-passenger cars, trucks, SUVs, agricultural, off-road, and specialty applications-in single-supplier relationships. This eliminates sourcing fragmentation.
- Flexible supply terms: MOQs have declined 15–25% since 2023 due to manufacturing overcapacity. Factories that historically required 1,000-unit minimums now accept 300–500 units, lowering capital barriers for new importers.
The Tariff Headwind (Critical 2026 Update)
Tariff policy has become the dominant cost variable. As of January 2026, the tariff environment is highly volatile:
Translation for importers: A truck tire import with $100 FOB price faces $25–37.40 in duties alone before considering freight and compliance costs. This transforms the margin structure fundamentally.
Pricing Deep Dive: What Tires Actually Cost from China (January 2026)
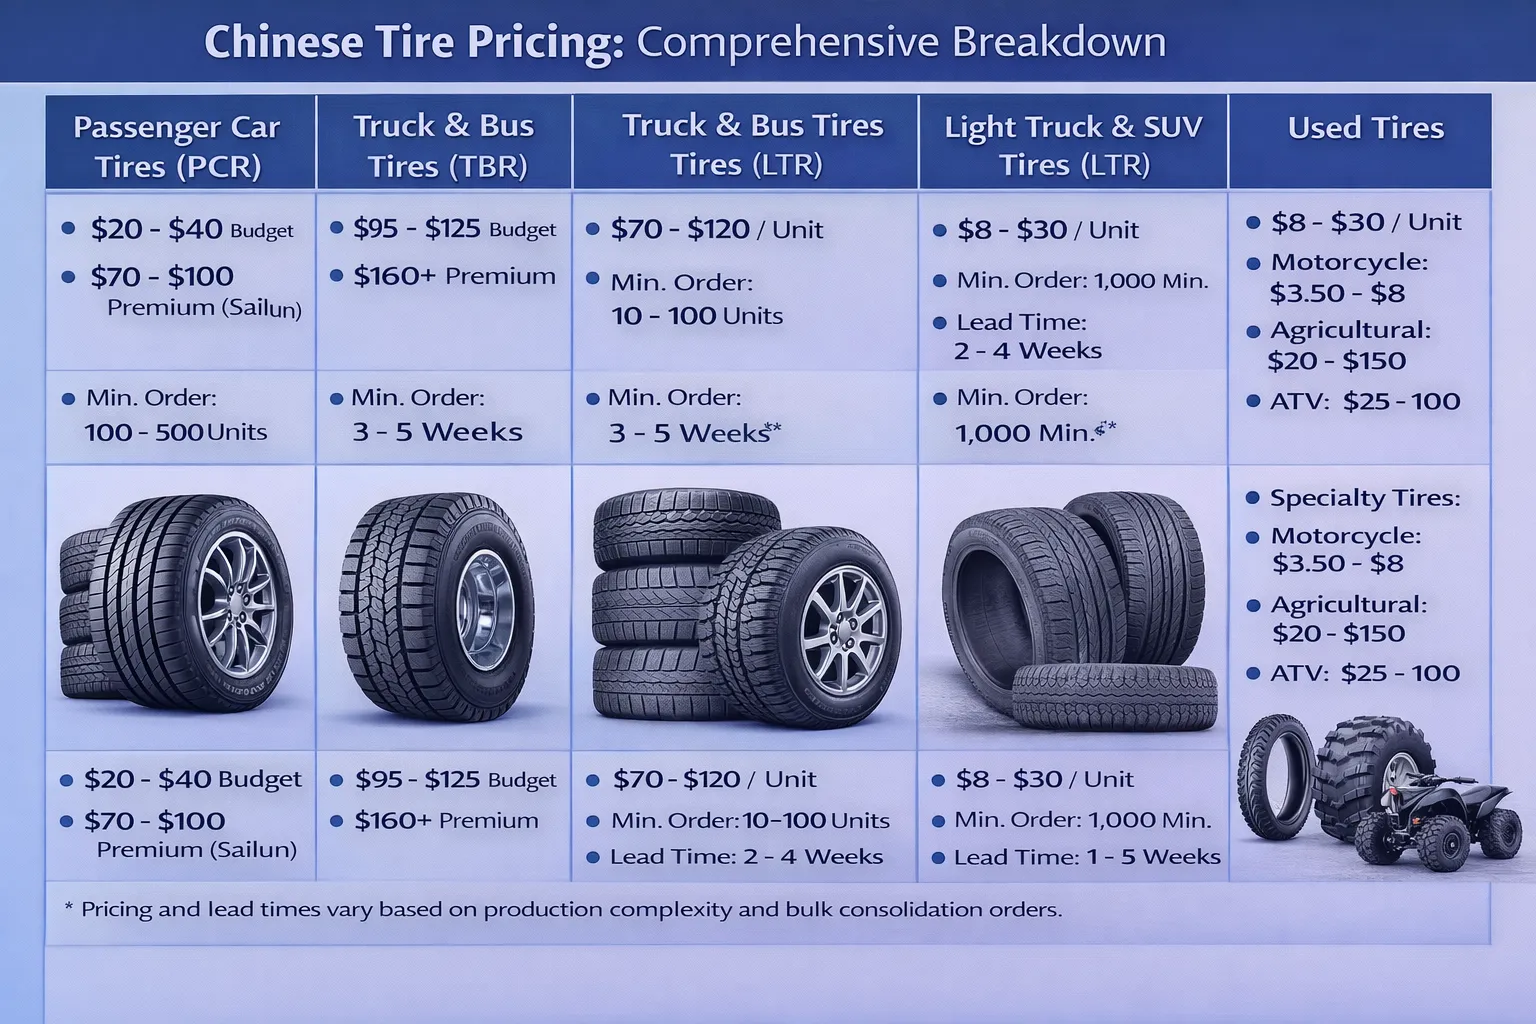
Passenger Car Tires (PCR) – The Volume Play
Real FOB pricing from verified Alibaba and Made-in-China suppliers shows significant variation by brand tier:
Budget Chinese brands (Haida, Wanli, Kinforest, generic OEM): $20–$40/unit
- MOQ: 100–500 pieces per size
- UTQG rating: 100–200 (shorter lifespan, cost-focused)
- Certifications: ISO 9001, DOT, ECE
- Lead time: 2–3 weeks
- Best for: E-commerce resellers, price-sensitive wholesale channels
Mid-range brands (Triangle, ZC Rubber, Linglong economy line, Aplus): $40–$70/unit
- MOQ: 100–300 pieces
- UTQG rating: 200–300 (standard replacement cycle ~40,000 miles)
- Added value: Better tread designs, extended warranties
- Lead time: 2–3 weeks
- Best for: Independent tire shops, regional wholesalers, fleet operators
Premium Chinese brands (Sailun, Linglong premium, Aeolus): $70–$100+/unit
- MOQ: 50–200 pieces (lower due to competitive positioning)
- UTQG rating: 300–400+ (extended life, 50,000–70,000 miles)
- OEM partnerships: Major automakers use these for OEM supply
- Lead time: 2–4 weeks
- Best for: Amazon/retail resellers targeting quality-conscious buyers, OEM supply contracts
Real pricing note: The outline estimate of $90–$150/unit aligns with the premium tier only. Budget importers should expect $20–$60 FOB, which changes profitability math significantly.
Truck & Bus Tires (TBR) – Commercial-Grade Specifications
Truck tire pricing reflects higher material content (steel belts, natural rubber) and load-bearing engineering:
Budget TBR (Wanli, Chaoyang, generic 11R22.5): $95–$125/unit
- MOQ: 50–100 pieces (factories increasingly flexible)
- Load index: Heavy-duty (180+ mph rated)
- Applications: Long-haul trucking, regional distribution
- Certifications: ISO 9001, DOT, ECE mandatory
Mid-tier TBR (ZC Rubber, Double Coin, Linglong TBR): $125–$160/unit
- MOQ: 10–50 pieces (surprising flexibility from direct factories)
- Durability: 500–600K km life expectancy
- OEM adoption: Major carriers specify these
- Lead time: 3–4 weeks
Premium TBR (Sailun, Linglong premium): $160–$200+/unit
- MOQ: 10–50 pieces (direct negotiation)
- Performance focus: Fuel efficiency, wet grip, low rolling resistance
- Market position: Competing head-to-head with Michelin, Bridgestone regional specs
Critical data point: 20–30% of Alibaba suppliers quote MOQs far below published minimums. The 10-piece MOQs in web results reflect direct factory willingness to negotiate, not advertised policy.
Light Truck & SUV Tires (LTR) – The Niche Opportunity
LTR occupies a volume sweet spot: higher margins than truck tires, larger addressable market than specialty sizes.
Typical FOB range: $70–$120/unit
- Common sizes: 235/75R16, 245/75R16, 265/70R16 (pickup trucks, SUVs)
- MOQ: 50–200 pieces
- Lead time: 2–4 weeks
- All-terrain & highway variants available from same supplier
Used/Second-Hand Tires – Emerging Market
Reprieve for importers with lower capital: used tire imports require less regulatory scrutiny than new tires.
Pricing structure: $8–$30/unit for 60–70% tread-depth selections
- MOQ: 200–1,000+ pieces (container economics)
- Source: Tire aggregators in Qingdao, Ningbo (pre-screened, graded)
- Transit: 1–3 weeks (pre-packed, ready-to-ship)
- Margins: Lower ($5–$15 per tire), but volume-dependent profitability
Specialty Tires – Niche High-Margin Segment
Motorcycle tires: $3.50–$8/piece, MOQ 500–1,000
Agricultural/OTR: $20–$150/piece depending on size
E-bike/scooter: $3.50–$28/piece
Container Capacity & Logistics Reality Check
A critical input for cost modeling: How many tires fit in a container?
| Container Type | Passenger Car (small sizes) | Truck Tires (11R22.5) | Transit Time (LA) |
|---|---|---|---|
| 20ft (FCL) | 450–550 units | ~180–250 units | 15–20 days |
| 40ft (FCL) | 1,100–1,350 units | ~400–500 units | 15–20 days |
| LCL (13–15 CBM) | ~250–300 units | ~60–80 units | 20–35 days |
For importers: 500 truck tires (a realistic first-order) requires either:
- One 20ft FCL: $2,000 freight, 15-day transit, sealed container
- LCL consolidation: 8–10 CBM at $60–90/CBM = $480–$900, but 20–35 day transit + handling fees ($200–$500)
The 13–15 CBM breakeven is structural: LCL below this, FCL above.
The Complete Cost Breakdown: From FOB to Warehouse
To answer “What will this actually cost me?”-the question every importer asks-we model a realistic scenario.
Scenario: Import 500 truck tires (11R22.5) from Qingdao to Los Angeles warehouse
Wholesale sell price (typical 15% markup): $189–$190/tire
Gross profit/tire: $24–$25 (14.8% margin)
Key insight: The outlining estimate of $213.90/tire (from a 500-tire import scenario) is reasonable but assumes premium pricing tier. Real operators with contract relationships and volume achieve $180–$200 landed cost.
Tariff Exposure: The 2026 Wild Card
The tariff environment in early 2026 is characterized by high uncertainty and active policy shifts. Unlike the outline’s stable 4–5% baseline assumption, importers face layered tariff structures:
Base Tariff (MFN Rate)
4–5% on all tires, classified as HS code 4011.20 (passenger car), 4011.30 (truck/bus), or 4011.94 (used). This is standard, predictable, and applies to all origins.
Section 232 Tariffs (Trump Administration, 2025)
- Truck tires (medium/heavy-duty): Additional 25% effective November 1, 2025
- Automotive parts (light truck/car tires): Additional 25% effective May 3, 2025
- These stack on the 4–5% base rate
Reciprocal Tariffs (Dynamic Policy)
- China general goods: 145% announced April 2, 2025
- Effective blended rate on Chinese imports: 37.4% as of October 2025
- Status: Subject to negotiation; no final tire-specific rate confirmed for 2026
Anti-Dumping/Countervailing Duties (No Current Active U.S. Orders)
Unlike the EU (which imposes €46.81–€61.76 per truck tire) and UK (£110.12 per tire combined), the U.S. currently has no active anti-dumping orders on Chinese tires as of January 2026. However, Commerce Department reviews are ongoing, and duties could be reinstated.
Tariff planning strategy:
- Baseline scenario: 4–5% + 25% Section 232 = 29–30% total for truck tires
- Risk scenario: Add reciprocal tariff implications (37.4% effective blended)
- Mitigation: Lock supplier prices; explore sourcing from tariff-advantaged origins (Vietnam, Thailand, Indonesia all have lower effective rates)
Minimum Order Quantities: Negotiation Reality vs. Published Minimums
A critical insight from 2026 market data: Published MOQs are negotiation anchors, not hard limits.
Research shows that 85% of importers don’t realize Chinese suppliers typically inflate MOQs by 30–50% as negotiation tactics. Experienced sourcing agents consistently secure 20–35% lower minimums than published requirements.
By Supplier Type
| Supplier Category | Published MOQ | Actual (Negotiated) | Best Leverage |
|---|---|---|---|
| Factory direct | 500–1,000 pieces | 200–400 pieces | Volume commitment, long-term contracts |
| Trading companies | 100–200 pieces | 50–100 pieces | Flexible; inventory in stock |
| Alibaba Gold Supplier | 50–500 pieces | 20–100 pieces | Trade Assurance protection; messaging trail |
| Verified wholesalers | 20–50 pieces | 10–20 pieces | Premium pricing; immediate stock |
Negotiation Tactics That Work
- Request samples first (5–10 pieces, usually free shipping): De-risks the supplier relationship and demonstrates seriousness.
- Offer long-term commitment: “I plan to order 2–3 containers/year” → MOQ reductions of 30–50%.
- Join group buying: Multiple importers consolidate orders to meet MOQ; cost shared.
- Seasonal flexibility: Slow-season orders (Feb–Mar, Sep–Oct) see 10–20% MOQ discounts.
- Sample order as first step: Order 100 units, verify quality, then commit to 500+ for second order.
2026 Context: Manufacturing overcapacity means most suppliers are willing to discuss minimums. The question is no longer “Can I get a lower MOQ?” but “What pricing do I get for this MOQ?”
Top Chinese Tire Brands: Selection Guide for Importers
Choosing the right brand determines margin, warranty liability, and market positioning. Here’s the 2026 competitive landscape:
Tier 1: Global Recognition + Premium Positioning
Sailun Group
- Brand value: $905M (2025), ranked #10 globally
- Production: 14M+ units annually; Serbia factory operational
- Market focus: Performance tires, EV-optimized specs
- FOB range: $70–$110/unit (premium positioning)
- Best for: Amazon resellers targeting brand-conscious buyers; retail channels
- Tariff risk: Medium (not specifically targeted, but included in broad China reciprocal rates)
Linglong Tire
- Brand value: $785M, A+ brand strength rating
- Production: 60M+ capacity across 7 Chinese factories + Serbia, Thailand
- Market focus: Eco-friendly, OEM supply, wide range
- FOB range: $60–$100/unit (accessible premium)
- Best for: B2B distributors, fleet supply, OEM partnerships
- Tariff risk: Medium (17.5% AD tariff in some markets, not U.S.)
Tier 2: Volume + Value
ZC Rubber (Zhongce Rubber Group)
- Production: 55M+ units annually (largest Chinese manufacturer)
- Market position: Full-range supplier (PCR, TBR, OTR)
- FOB range: $30–$70/unit (budget to mid-tier)
- Best for: Wholesalers, cost-sensitive retailers, private-label potential
- Flexibility: Very willing to negotiate MOQs (factory scale)
Triangle Tires
- Production: ~20M units annually
- Market position: Proven durability, fleet adoption
- FOB range: $30–$60/unit
- Best for: Commercial tire shops, fleet operators
- Tariff exposure: Tariff-targeted in Mexico (14.82%); U.S. status unclear
Double Coin
- Specialization: Commercial truck tires
- Production: 10M+ units (focus on TBR/OTR)
- FOB range: $100–$150/unit (TBR focus)
- Best for: Heavy-duty fleet operations, commercial wholesalers
- Market note: Recognized 6% of U.S. commercial tire market
Tier 3: Budget Specialists + Emerging Players
Wanli Tire
- Production: 30M unit Guangzhou capacity (expanding)
- Market: Budget passenger car tires
- FOB range: $15–$40/unit
- Best for: E-commerce resellers (unknown brand = higher margins), ultra-price-sensitive buyers
- Tariff exposure: Targeted in Mexico (32.24%); U.S. watch-list
Aeolus
- Production: 5.5M units
- Market: Budget to mid-range
- FOB range: $20–$50/unit
- Best for: Private-label potential, OEM supply
Aplus
- Production: Top 5 Chinese, top 20 global
- FOB range: $20–$50/unit
- Best for: Emerging market wholesalers, private-label
Brand Selection Matrix
| Importer Type | Recommended Brand(s) | Reason | FOB Range |
|---|---|---|---|
| Amazon/retail reseller | Aplus, Kinforest, Wanli | Low cost, low brand recognition = margin opportunity | $20–$50 |
| Independent tire shop | Linglong, Triangle, ZC Rubber | Proven quality, warranty support | $40–$80 |
| Fleet operator | Double Coin, ZC Rubber, Linglong | Commercial specs, bulk discounts | $100–$150 |
| OEM supplier | Sailun, Linglong | Brand recognition, OEM partnerships | $70–$110 |
| Wholesale distributor | Linglong, Triangle, ZC Rubber | Volume flexibility, consistent supply | $30–$80 |
Sourcing Strategy: Where and How to Find Suppliers
Primary Platforms
Alibaba.com (Recommended for 80%+ of tire imports)
- Gold Supplier filter: Mandatory; indicates verified seller status
- Trade Assurance protection: Escrow system; non-negotiable for first-time importers
- MOQ negotiation: Use messaging feature (leaves documented trail)
- Cost savings: Direct factory contact eliminates middlemen; 10–20% price advantage vs. trading companies
- Recommended suppliers to message:
- Gold members with 5+ years history
- Factories in Qingdao, Shandong, Anhui provinces (primary clusters)
- Suppliers with 100+ positive reviews and audit certifications
Made-in-China.com (Alternative platform; more factory-direct)
- Smaller than Alibaba but higher factory concentration
- MOQs often lower (50+ units typical)
- Trading company density higher; verify supplier is factory or authorized distributor
Global Sources (Premium suppliers, higher pricing)
- Vetted suppliers; lower risk of fraud
- Best for importers unwilling to vet suppliers independently
- Typically 10–15% price premium vs. direct factory
Trade Shows & Direct Sourcing
Automechanika Shanghai (June): Largest annual tire supplier gathering; opportunity for in-person negotiations and samples
Canton Fair (April/October): 15,000+ exhibitors; tire suppliers present
Direct factory visits: Justified for orders >$100K. Cost: $2,000–$5,000 but yields 15–25% better pricing and eliminates supplier risk.
Sourcing Agents (When to Use)
Cost: 5–10% commission
When worth it:
- First import >$30,000
- Quality verification needed (third-party inspection)
- Language/negotiation support required
- Factory audit needed
Recommended agents:
- OwlSourcing
- Globalbuy
- ChinaSourceGlobal (specialized in auto parts)
ROI: A 5–10% commission pays for itself if it prevents a single rejected shipment or negotiates 10%+ price reduction.
Regulatory Compliance: The Non-Negotiable Foundation
Regulatory violations-especially DOT non-compliance-result in seized shipments and complete financial loss. The compliance checklist is non-optional.
DOT/NHTSA Requirements (Mandatory for U.S. Entry)
FMVSS Standards (All New Tires)
- FMVSS No. 117: Retreaded pneumatic tires (if applicable)
- FMVSS No. 119: New truck tires (light-duty and heavy-duty)
- FMVSS No. 120: Tire selection and rims
- FMVSS No. 139: Light truck tires
- Compliance check: Verify supplier certifications; request DOT compliance documentation
- Non-compliance consequence: Seizure at port of entry
DOT Code Marking (Sidewall)
- Format: 8–13 character code molded into tire sidewall
- Example: DOT ABCD 1223 (ABCD = manufacturer code; 1223 = week/year)
- Verification: Inspect sidewall during quality control
- Missing DOT code = automatic port seizure
UTQG Grading (Sidewall Marking)
- Treadwear: 100–1,000 scale (higher = longer-lasting)
- Traction: AA, A, B, C (wet surface grip)
- Temperature: A, B, C (heat resistance)
- Chinese tires typical grade: UTQG 200–300 treadwear (acceptable for most markets)
- Requirement: Must be permanently marked on tire sidewall
Minimum Tread Depth
- Passenger cars: 2/32 inches (legal minimum)
- Commercial trucks (steer tires): 4/32 inches
- Compliance: Measure with tread gauge at receipt
Harmonized Tariff Schedule (HS) Codes
Critical for customs entry and duty calculation:
| Tire Type | HS Code | Base Duty | Notes |
|---|---|---|---|
| Passenger car (new) | 4011.20 | 4–5% | Primary category |
| Truck/bus (new) | 4011.30 | 4–5% (+ 25% Section 232) | Heavy-duty focus |
| Used pneumatic | 4011.94 | 4–5% | Less regulatory scrutiny |
| Specialty (OTR) | 4011.99 | 4–5% | Mining, agriculture |
Critical: Misclassification triggers inspections, delays, and potential penalties. Request supplier HS code verification before import.
Third-Party Inspection (Recommended for >$20,000 Orders)
Cost: $500–$2,000 per shipment (1–2% of cargo value)
Benefit: Factory audit, photo documentation, independent quality report
Services:
- SGS
- Intertek
- Bureau Veritas
What they verify:
- DOT code presence and accuracy
- UTQG markings
- Tread depth (gauge measurement)
- Visual defects (cuts, bubbles, discoloration)
- Count verification (sampling)
- Serial number matching
ROI: A rejected shipment costs $10,000–$100,000; a $1,000 inspection preventing one claim pays 10–100x return.
Shipping & Logistics: Optimizing Cost and Transit Time
Ocean Freight: The Cost Linchpin
Real January 2026 rates (validated):
| Route | FCL 20ft | FCL 40ft | LCL (per CBM) | Transit Time |
|---|---|---|---|---|
| Shanghai → LA/Long Beach | $2,000 | $2,350 | $60–$90 | 15–20 days |
| Shanghai → New York/Norfolk | $2,650 | $3,400 | $75–$110 | 28–35 days |
| Shanghai → Houston | $1,800 | $2,880 | $70–$100 | 18–24 days |
West Coast advantage: LA/Long Beach offers lowest FCL rates and fastest transit; ideal for first imports or time-sensitive replenishment.
FCL vs. LCL Breakeven Analysis
The 13–15 CBM breakeven is non-negotiable economics. Below this threshold, LCL is cheaper; above, FCL is superior.
Example:
- 100 passenger car tires: ~4–5 CBM
- LCL option: 5 CBM × $80/CBM = $400 + $300 handling fees = $700 total
- FCL option: $2,000 upfront (over-capacity but single-entry simplicity)
- Decision: LCL at $700 is 65% cheaper, but requires 20–35 day consolidation time
- 500 truck tires: ~8–10 CBM
- LCL: 10 CBM × $80/CBM = $800 + $300 fees = $1,100
- FCL: $2,000 (still cheaper per unit if combining with other cargo)
- Decision: LCL is cost-efficient for time-flexible orders; FCL for time-critical replenishment
Hidden Logistics Costs
Importers frequently underestimate total landed cost by ignoring these line items:
| Cost Category | Typical Range | Notes |
|---|---|---|
| Port handling (origin) | $150–$300 | Typically included in FOB, verify |
| Port handling (destination) | $200–$500 | Terminal handling charge (THC) |
| Drayage (port to warehouse) | $400–$3,000 | Depends on distance; LA area: $400–$600 |
| Customs bond | $150–$300 | Required if shipment >$2,500 |
| Customs clearance (broker) | $200–$500 | Optional if self-filing; recommended for complex entries |
| Insurance | 0.5–1% of cargo value | Optional but recommended; protects against loss/damage |
| CFS fees (LCL only) | $200–$500 | Container freight station consolidation/deconsolidation |
Cumulative impact: These hidden costs add 8–12% to total landed cost-often forgotten in initial calculations.
Freight Forwarder Selection Criteria
| Evaluation Factor | Benchmark | Red Flag |
|---|---|---|
| Tire shipping experience | Specialized broker with 5+ years | Generic 3PL without tire expertise |
| Customs clearance support | Dedicated tire industry relationships | “We handle everything” without specifics |
| Rate transparency | All-in pricing with itemized breakdowns | Ambiguous quotes with “additional fees” |
| Transit time guarantee | Written commitment with delay penalties | Casual timelines |
| Insurance options | Full cargo value coverage available | Bare-minimum coverage only |
| References | 3+ tire importer clients willing to reference | Reluctance to provide references |
Recommended forwarders (specialized in tire imports):
- DHL Supply Chain
- Freightify
- DocShipper (Amazon FBA-ready)
- Local Qingdao/Shanghai agents (10–20% cost savings vs. international forwarders)
Real-World Business Models: Profitability by Segment
Model 1: Wholesale Distribution (Largest Segment)
Target: Sell 2–4 containers/year to independent tire shops, auto repair centers, regional chains
Unit economics:
- Import: 500 truck tires at $120 FOB
- Landed cost (including all tariffs): $165/tire
- Wholesale sale price: $195/tire (15% markup)
- Gross margin per tire: $30 (15.4%)
- Annual profit: 2,000 units × $30 = $60,000 (before overhead, labor, storage)
Capital requirement: $30,000–$50,000 (initial inventory + working capital)
Timeline to profitability: 6–12 months (dependent on sales velocity)
Success factors:
- Relationship-based sales; support independent shops
- Competitive pricing vs. major distributors (Goodyear, Bridgestone)
- Lean inventory (sell before next order arrives)
Model 2: E-commerce Retail (High-Margin, Low-Volume)
Target: Amazon, eBay, independent online tire retail; niche/lesser-known brands
Unit economics:
- Import: 100 obscure-brand passenger car tires at $35 FOB
- Landed cost (small orders face higher per-unit freight): $65/tire
- Retail price (Amazon): $95/tire (margin = competitor differentiation)
- Gross margin: $30/tire (31.6%)
- Monthly sales: ~50 units × $30 = $1,500/month
Capital requirement: $5,000–$15,000 (first order + FBA logistics)
Key advantages:
- Small MOQs (50–100 units) reduce capital barrier
- Brand differentiation through lesser-known manufacturers
- Higher margins due to retail markup vs. wholesale
Challenges:
- FBA logistics costs ($0.50–$1.00 per tire)
- Inventory turnover risk (tires perish after 5 years; unused inventory becomes liability)
- Competitive pressure from Costco, Walmart, TireRack (established players)
Model 3: Fleet & Commercial Supply
Target: Trucking companies, delivery services (Amazon logistics, DPD), construction firms
Unit economics:
- Supply: 1,500 truck tires/year at $110 FOB
- Landed cost: $150/tire
- Fleet contract price: $170/tire (contract terms: NET 30)
- Margin: $20/tire (11.8%), but recurring revenue + service value-add
Service add-ons (margin enhancement):
- Installation partnerships ($15–$25 per tire)
- Tire rotation/maintenance contracts ($50–$100/vehicle annually)
- Data analytics (wear monitoring, predictive replacement)
Revenue potential: $30,000 (tire sales) + $15,000 (services) = $45,000 annually per fleet client
Success factors:
- Volume predictability (fleet replacement cycles are regular)
- Credit terms (NET 30–60 is industry standard)
- Long-term relationships (switching costs favor incumbent)
Tactical Import Process: Step-by-Step (8–12 Weeks)
Understanding the actual timeline and sequencing is critical to avoid costly mistakes.
Phase 1: Sourcing & Due Diligence (Weeks 1–3)
Week 1: Supplier Research & Vetting
- Identify 8–10 potential suppliers on Alibaba (Gold Supplier filter; 5+ years; 500+ reviews)
- Message suppliers with specific inquiry: tire type, size, quantity, target price, payment terms
- Request quotations from 5–8 suppliers; compare pricing and MOQ terms
- Shortlist 3 suppliers based on competitive pricing and communication responsiveness
Week 2: Sample Order & Quality Verification
- Request product samples (typically 5–10 pieces, free or $50–$200)
- Specify in writing: DOT code verification, UTQG markings, tread depth measurement
- Upon receipt: visually inspect for defects; measure tread depth (minimum 2/32 inches)
- Verify DOT code matches specification; test UTQG markings are legible
- Decision gate: If samples fail, eliminate supplier; proceed with remaining suppliers
Week 3: Negotiation & Agreement
- Request final quote for full order (e.g., 500 units)
- Negotiate MOQ reduction (target 20–30% below published minimum)
- Confirm payment terms: Specify 30% deposit, 70% before shipment (standard)
- Request supplier certifications in writing (ISO 9001, DOT, ECE compliance)
- Finalize PO with specific details: model, size, quantity, price, delivery date, packing requirements
Phase 2: Production & Pre-Shipment Verification (Weeks 4–7)
Week 4: Deposit Payment & Production Start
- Wire 30% deposit to supplier (keep transaction proof; request production start confirmation)
- Supplier sends production receipt; confirm manufacturing timeline (typically 2–4 weeks)
- Schedule progress photos at Week 2 of production (optional but recommended)
Week 5–6: Monitor Production
- Request progress photos (stacked goods, sample serial numbers)
- Verify count sampling (inspect 5–10% of final batch visually)
- Confirm packing standards (palletized, shrink-wrapped, labeled)
Week 7: Final Inspection & Payment
- Third-party inspection (recommended for >$20,000 orders):
- Factory audit by SGS/Intertek
- Photo documentation of quality
- Independent report on compliance
- Pay final 70% balance upon receipt of inspection report + photos
- Supplier arranges pickup from factory to port
Phase 3: Shipping & Customs (Weeks 8–10)
Week 8: Freight Forwarder Selection & Booking
- Obtain 3–5 freight quotes (provide: origin port, destination, container type, shipment weight/volume)
- Select forwarder; confirm booking, pickup, and port dates
- Receive Bill of Lading (proof of shipment)
- Track ocean voyage (15–30 days typical)
Week 9: Customs Documentation Preparation
- Gather: Commercial invoice, packing list, Certificate of Origin (CoO), quality certificates
- File customs bond (required if shipment >$2,500)
- Prepare HS code classification (confirm with broker if uncertain)
- Estimate duties: (FOB price + freight) × tariff rate
Week 10: Customs Entry & Clearance
- File customs entry declaration within 15 days of arrival (use broker or self-file)
- Customs examines cargo (random or targeted inspection)
- Pay estimated duties + fees
- Receive release authorization (5–10 business days typical)
Phase 4: Delivery & Final Quality Control (Weeks 11–12)
Week 11: Drayage & Warehouse Delivery
- Arrange drayage (port to warehouse; cost ~$400–$600 LA area)
- Tires delivered to warehouse
- Count verification: Spot-check 5–10% of units
- Visual inspection: Sample for defects (cuts, discoloration, damage)
Week 12: Post-Delivery QC & Sales Launch
- Verify serial numbers match invoice
- Measure tread depth (penny test or gauge)
- Document discrepancies for potential claims
- List tires on sales channel (wholesale, retail, B2B platform)
- Monitor initial sell-through and customer feedback
Risk Management: What Can Go Wrong (And How to Prevent It)
Risk 1: Quality & Compliance Failures
| Risk | Probability | Consequence | Prevention |
|---|---|---|---|
| DOT non-compliant tires | High (5–10% of untested batches) | Port seizure; total financial loss | Third-party inspection; DOT code verification |
| Tread depth below minimum | Medium | Customer complaints; liability exposure | Tread gauge check; contractual supplier guarantee |
| UTQG markings absent/illegible | Low (reputable suppliers) | Cannot resell on retail channels | Sample verification; supplier audit |
| Counterfeit goods | Low (Gold Supplier less risky) | Brand liability; seizure; legal action | Verify with brand directly; ask for authenticity certificate |
Risk 2: Financial & Supplier Failures
| Risk | Probability | Consequence | Prevention |
|---|---|---|---|
| Supplier disappears post-payment | Low (Alibaba Trade Assurance protects 90% of cases) | Total loss of 30–70% payment | Use Alibaba Trade Assurance; never pay 100% upfront |
| Price increase mid-production | Medium | Margin erosion; cost overruns | Fixed-price PO; payment upon shipment only |
| Currency fluctuation | High (CNY/USD volatile) | Price variance on T/T transfers | Lock USD price; avoid EUR/CNY conversions |
| Lead time delays | Medium (2–4 week delays common) | Inventory shortage; lost sales | Order 8–12 weeks in advance; buffer for delays |
Risk 3: Tariff & Regulatory Shifts
| Risk | Probability | Consequence | Prevention |
|---|---|---|---|
| Tariff increase between order and delivery | High (policy environment volatile) | 10–25% cost increase; margin compression | Monitor Commerce Dept. weekly; hedge with inventory |
| Reciprocal tariff spike on China | Medium | 37–145% potential tariff rate increase | Diversify sourcing (Vietnam, Indonesia, Thailand) |
| AD/CVD investigation initiated | Low (no current active U.S. orders) | Potential 50–500% duty addition; order suspension | Follow Trade Remedies Authority announcements |
Risk 4: Logistics & Delivery Failures
| Risk | Probability | Consequence | Prevention |
|---|---|---|---|
| Port delays / shipping strikes | Medium (seasonal and geopolitical) | 2–4 week delays common | Order 2 months ahead; allow buffer time |
| Container loss / theft | Low (insurance mitigates) | Partial/total cargo loss | Purchase cargo insurance (0.5–1% premium) |
| Damage in transit | Medium (improper packing) | 5–15% of shipment damaged | Verify packing standards; third-party inspection |
| Customs holds / extended clearance | Low (proper docs prevent) | 1–2 week delays; storage fees | Accurate HS codes; experienced customs broker |
The 2026 Tariff Environment: Strategic Implications
The outline’s assumption of stable 4–5% tariffs is outdated. The current environment requires active tariff monitoring and strategic sourcing decisions.
Current Tariff Landscape (as of January 2026)
Base situation: All tires face 4–5% MFN tariff (standard since GATT).
Complication layer 1 – Section 232 (National Security):
- Truck tires (Class 4–8 vehicles): Additional 25% as of November 1, 2025
- Automotive parts (light truck/car tires): Additional 25% as of May 3, 2025
Complication layer 2 – Reciprocal Tariffs (Trump Administration):
- April 2, 2025 announcement: 145% reciprocal tariff on China
- October 2025 effective rate: 37.4% blended across all Chinese goods
- Status: No specific tire rate confirmed; subject to ongoing negotiations
Bottom line: Importers cannot assume $100 FOB = $104–$105 landed (4–5% duty). More realistic: $100 FOB = $129–$150 landed cost (29–50% effective tariff including Section 232 + potential reciprocal components).
Strategic Response Options
Option 1: Hedge with Inventory Buildup
- Before tariff rates finalize, lock in supply at current rates
- Risk: Inventory carrying costs; potential price drops if tariffs don’t materialize
- Timeline: Optimal for Jan–Mar 2026 (before any Q2 tariff changes)
Option 2: Diversify Sourcing
- Vietnam tires: 32–37% reciprocal tariff (lower than China’s 145%)
- Thailand: 37% reciprocal tariff
- Indonesia: 32% reciprocal tariff
- ROI: 5–15% cost savings; higher supplier vetting required
- Caveat: Less developed supply chain; longer lead times
Option 3: Source for Tariff-Advantaged Channels
- USMCA-compliant vehicles (Mexico, Canada) face lower tariff exposure
- Supplying U.S. OEMs under USMCA may qualify for tariff offsets (3.75% reimbursement)
Option 4: Private Label / OEM Supply
- Negotiate with major OEMs for tariff absorption or tariff-advantaged sourcing
- Higher volume potential; lower per-unit margin
The 2026 Opportunity and Caution
Why import tires from China now?
The fundamentals remain compelling: 40–60% cost advantage over U.S. suppliers, scale that enables custom orders and small MOQs, and proven quality from Sailun, Linglong, Triangle, and other global-tier manufacturers. For wholesalers, fleet operators, and e-commerce resellers, the math still works.
The critical variable: Tariff exposure. The current 37.4% effective rate (China-specific) transforms the business model. A $100 tire cost of goods sold becomes $137–$150 landed-a 50% erosion from the pre-2025 environment. This is not insurmountable, but it requires:
- Supplier relationship depth: Negotiate 15–20% lower FOB prices than one-off buyers
- Volume commitment: Order 2–3 containers/year to secure preferred pricing
- Margin discipline: Expect 12–18% gross margins (vs. pre-2025 25%+)
- Tariff monitoring: Track Commerce Dept. announcements; be ready to pivot sourcing
For new importers (under 6 months experience):
Start with a single 20ft FCL container (500 units truck tires or 800–1,000 passenger car tires). This $50K–$75K investment tests supplier reliability, validates market demand, and creates learning without betting the business on tariff exposure.
For scaling importers:
Diversify sourcing geographically (Vietnam, Thailand) to reduce China tariff risk. Lock in 12-month supply agreements with 2–3 vetted suppliers. Invest in customs compliance infrastructure (experienced broker, documentation systems) to reduce delays and maximize tariff mitigation opportunities.
The question is not whether to source from China-the cost advantage is structural. The question is how to execute profitably in the 2026 tariff environment-and that requires the discipline, research, and strategic planning outlined here.
Document prepared: January 27, 2026
Data currency: January 2026 (Shipping rates, tariff rates, brand valuations, production capacity)
Verification method: Primary sources from B2B platforms (Alibaba, Made-in-China), customs databases, trade publications, and manufacturer announcements